
Ecommerce · Anonymous client case study
30% more Google search clicks, year over year.
A connected content, search and store programme for a vape retailer.

Working together.
- Industry
- Vape retail
- Engagement
- November 2024–present
- Delivery
- In-house
The brief
Build authority.
Improve the store
behind it.
The client wanted to build topical authority through a semantic content network, supported by a better shopping experience and infrastructure ready for growth.
CartCompound’s ongoing engagement began in November 2024. The brief covered ecommerce SEO, modern search discovery, website design, content, conversion optimisation and backend improvements.
The work
Four connected areas.
Delivered in-house.
Our in-house team delivered four connected areas of work.
Semantic content strategy and production.
Developed the content network around related topics, combining ecommerce SEO, content planning and production to support the client’s topical-authority goals.
Explore content strategyTechnical SEO and modern search preparation.
Worked on the site’s technical and semantic foundations to support Google search, GEO and discovery through LLMs.
Explore technical SEOWebsite experience and conversion.
Revamped website design and content, with CRO work focused on the shopping experience.
Explore design and developmentBackend infrastructure.
Optimised the infrastructure supporting the store as part of the wider programme.
Explore commerce systemsThe results
The difference,
in the search data.
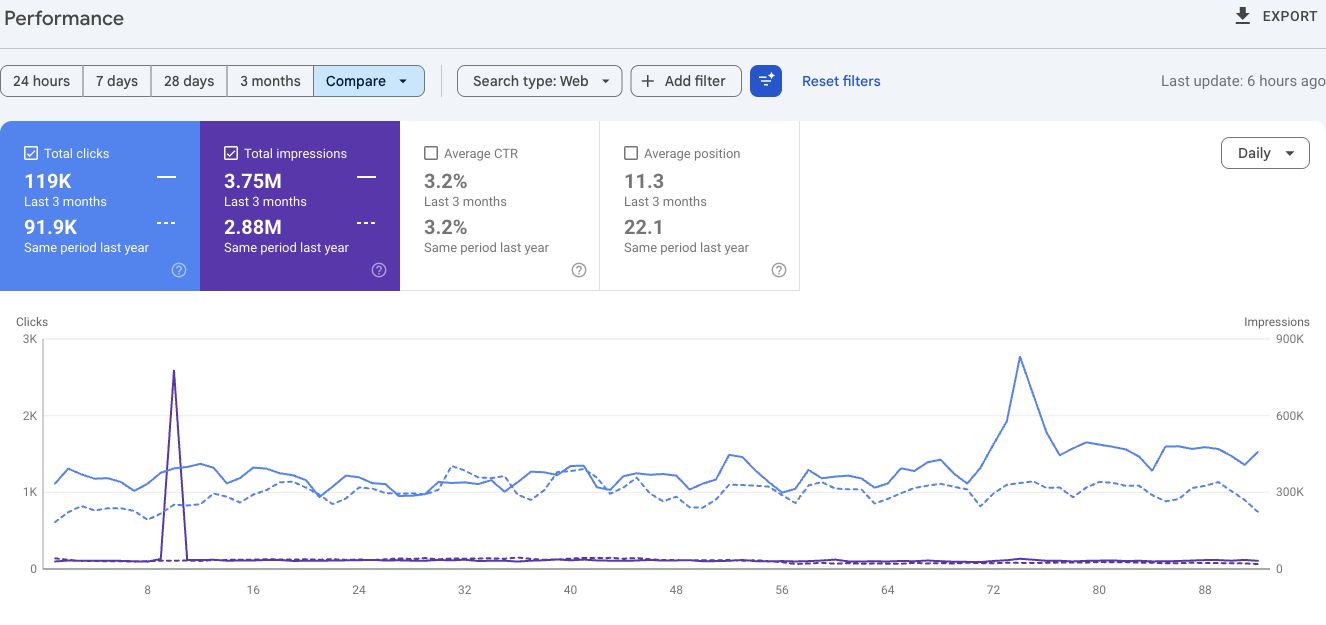
The verified Google Search Console comparison shows:
 View original at full size
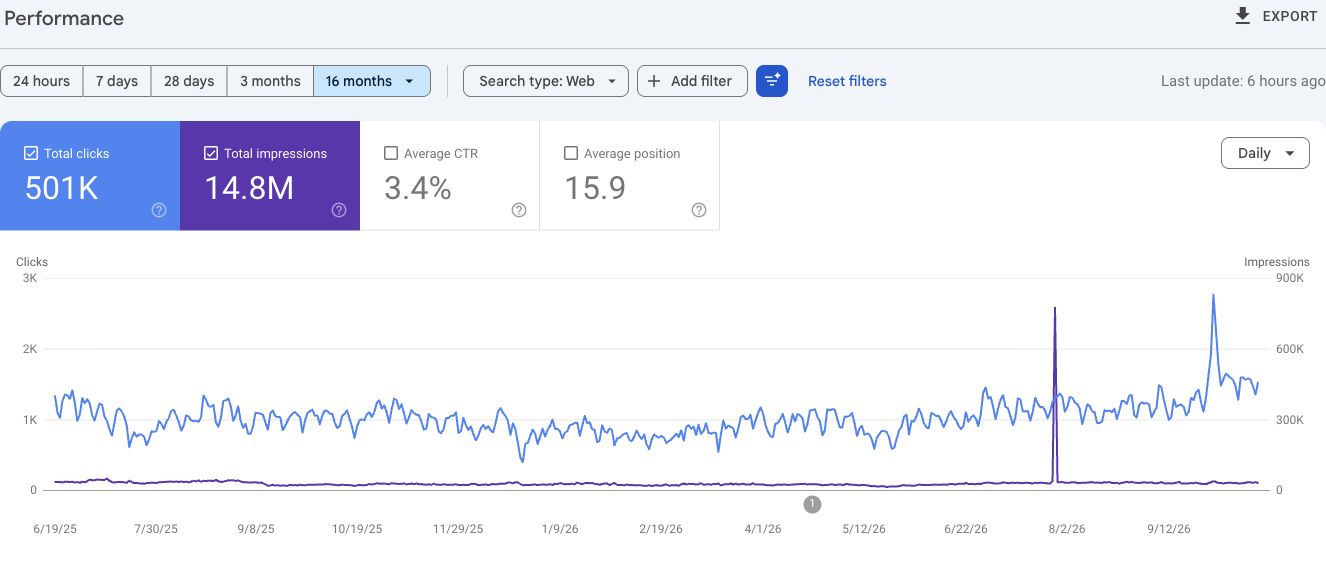
See the longer search trend
 View original at full size
Same dates. One year apart.
Google search clicks
+30.0% year over yearGoogle search impressions
+30.0% year over year| Google Web search metric | 19 Jul–18 Oct 2025 | 19 Jul–18 Oct 2026 | Change |
|---|---|---|---|
| Clicks | 91,860 | 119,413 | +30.0% |
| Impressions | 2,883,868 | 3,749,585 | +30.0% |
Reading the results
What the comparison tells us.
Both reporting periods cover 92 days during the ongoing engagement. The figures include branded and non-branded searches, with no additional segment filters applied.
These results show an increase in search visibility and clicks across the measured periods. They do not isolate the effect of any individual change or establish growth since the website revamp.
Modern search, made visible
A growing presence
in generative search.
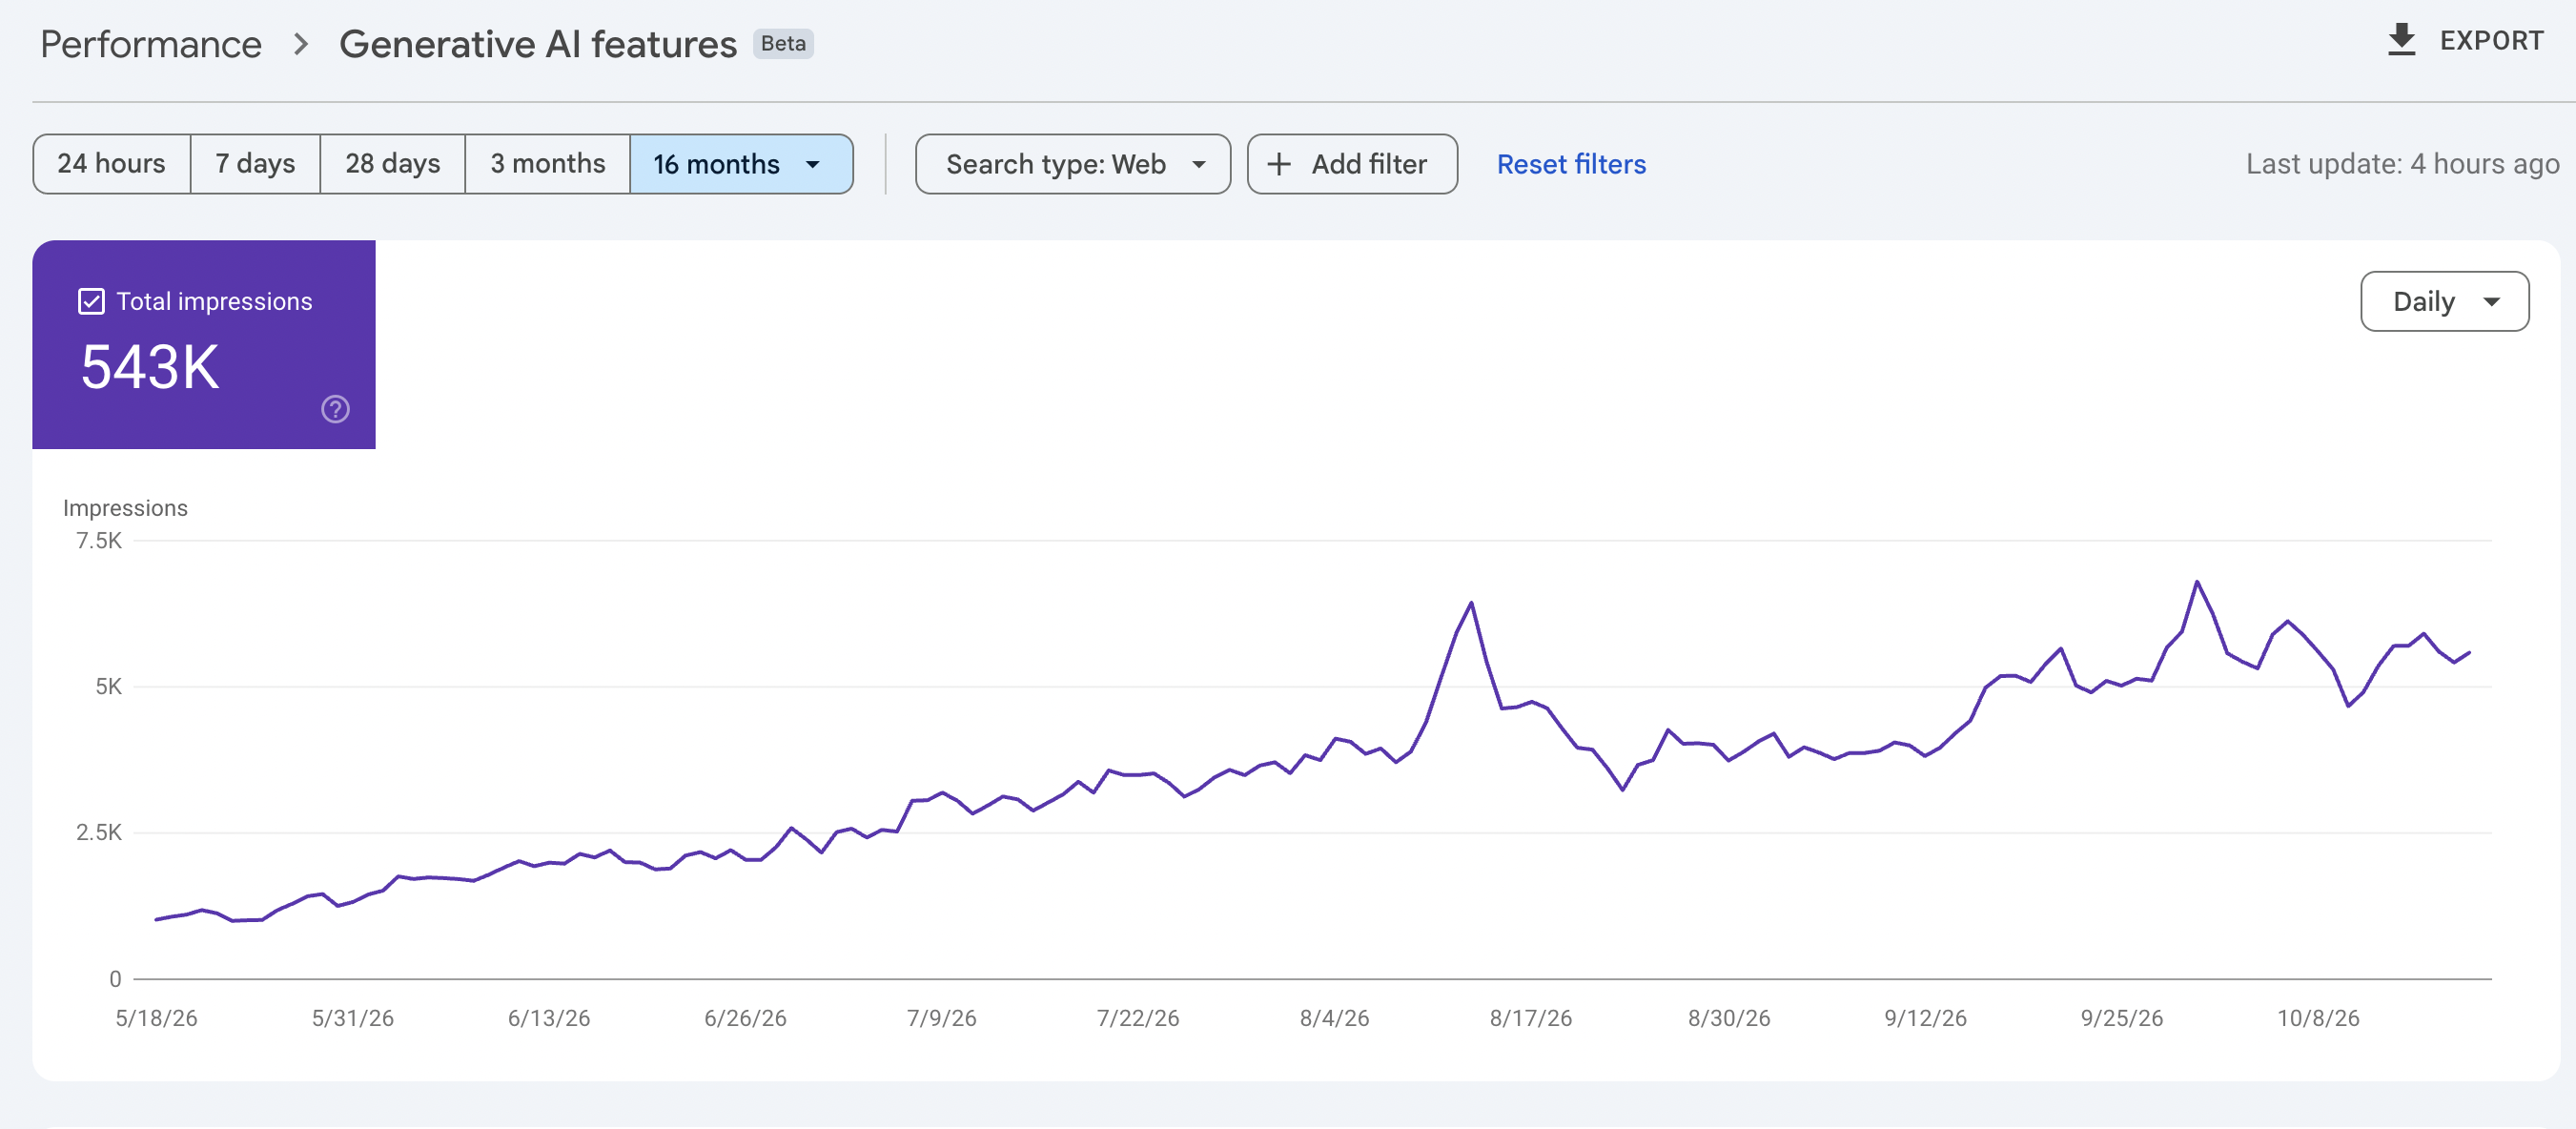
generative AI features18 May–18 October 2026
The site’s content is appearing in Google’s generative AI search features. The real report below shows the rising impression trend across the available data.
 View original at full size
Visibility is one part of the picture.
This report measures impressions in Google’s generative AI features. It does not measure leads, sales or visibility across every AI model. The evidence supports a growing Google AI presence; it does not isolate the contribution of any one optimisation.
Inside the Shopify store
The commercial picture.
From the dashboard.
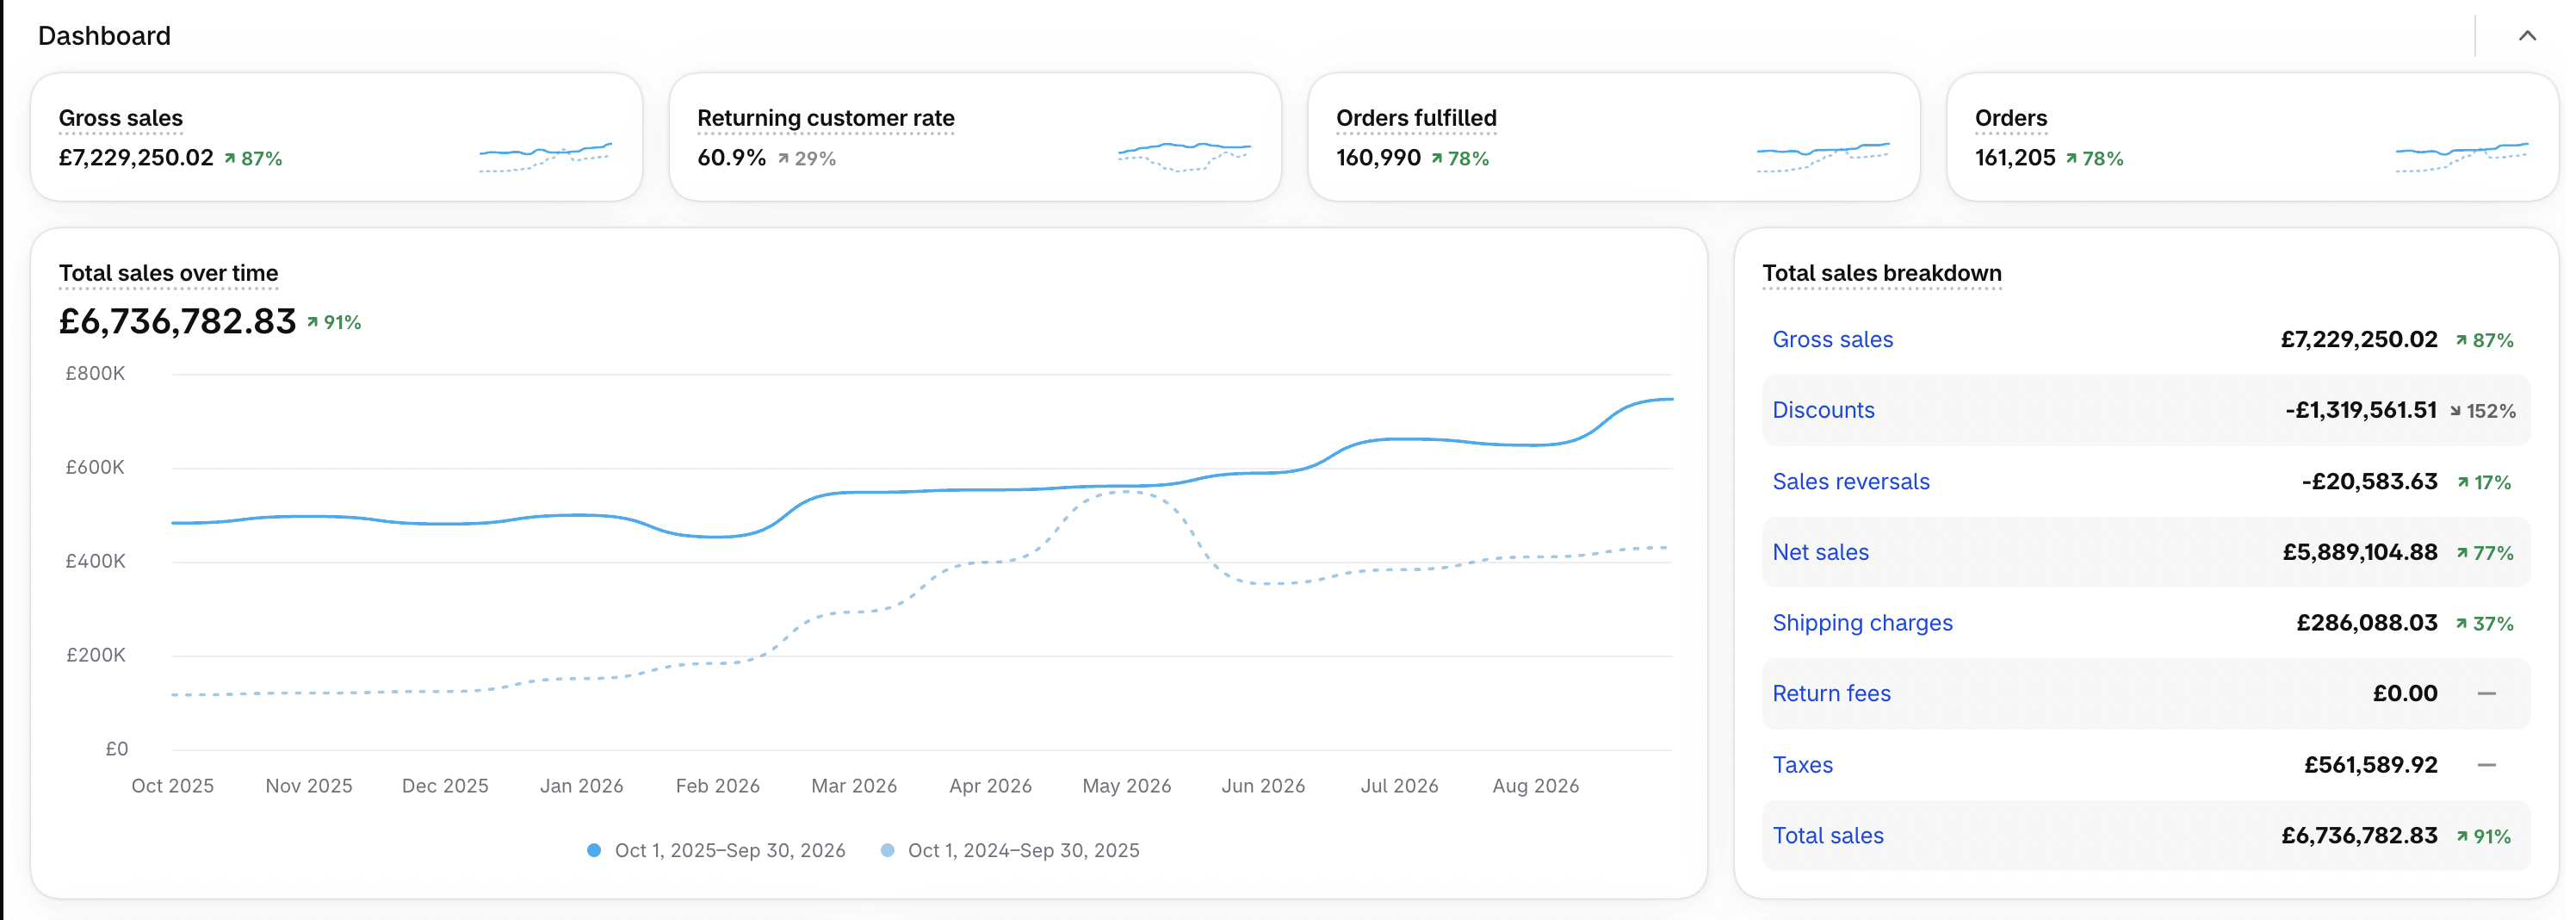
Search visibility matters in the context of the business behind it. Here is the store’s reported performance during the ongoing engagement.
£6,736,782.83 · 1 Oct 2025–30 Sep 2026
 View original at full size
What makes up
the sales total.
Gross, net and total sales are different measures. The breakdown keeps the headline grounded in the actual report.
- Gross sales
- £7,229,250.02
- Discounts
- −£1,319,561.51
- Sales reversals
- −£20,583.63
- Net sales
- £5,889,104.88
- Shipping charges
- £286,088.03
- Taxes
- £561,589.92
- Total sales
- £6,736,782.83
A store result, in its proper context.
The total sales and order increases cover all sales channels. They are not presented as revenue created solely by SEO or CartCompound. The engagement was active during both comparison periods, and other business factors can affect the outcome.
How traffic meets commerce
Marketing contribution.
Channel context.
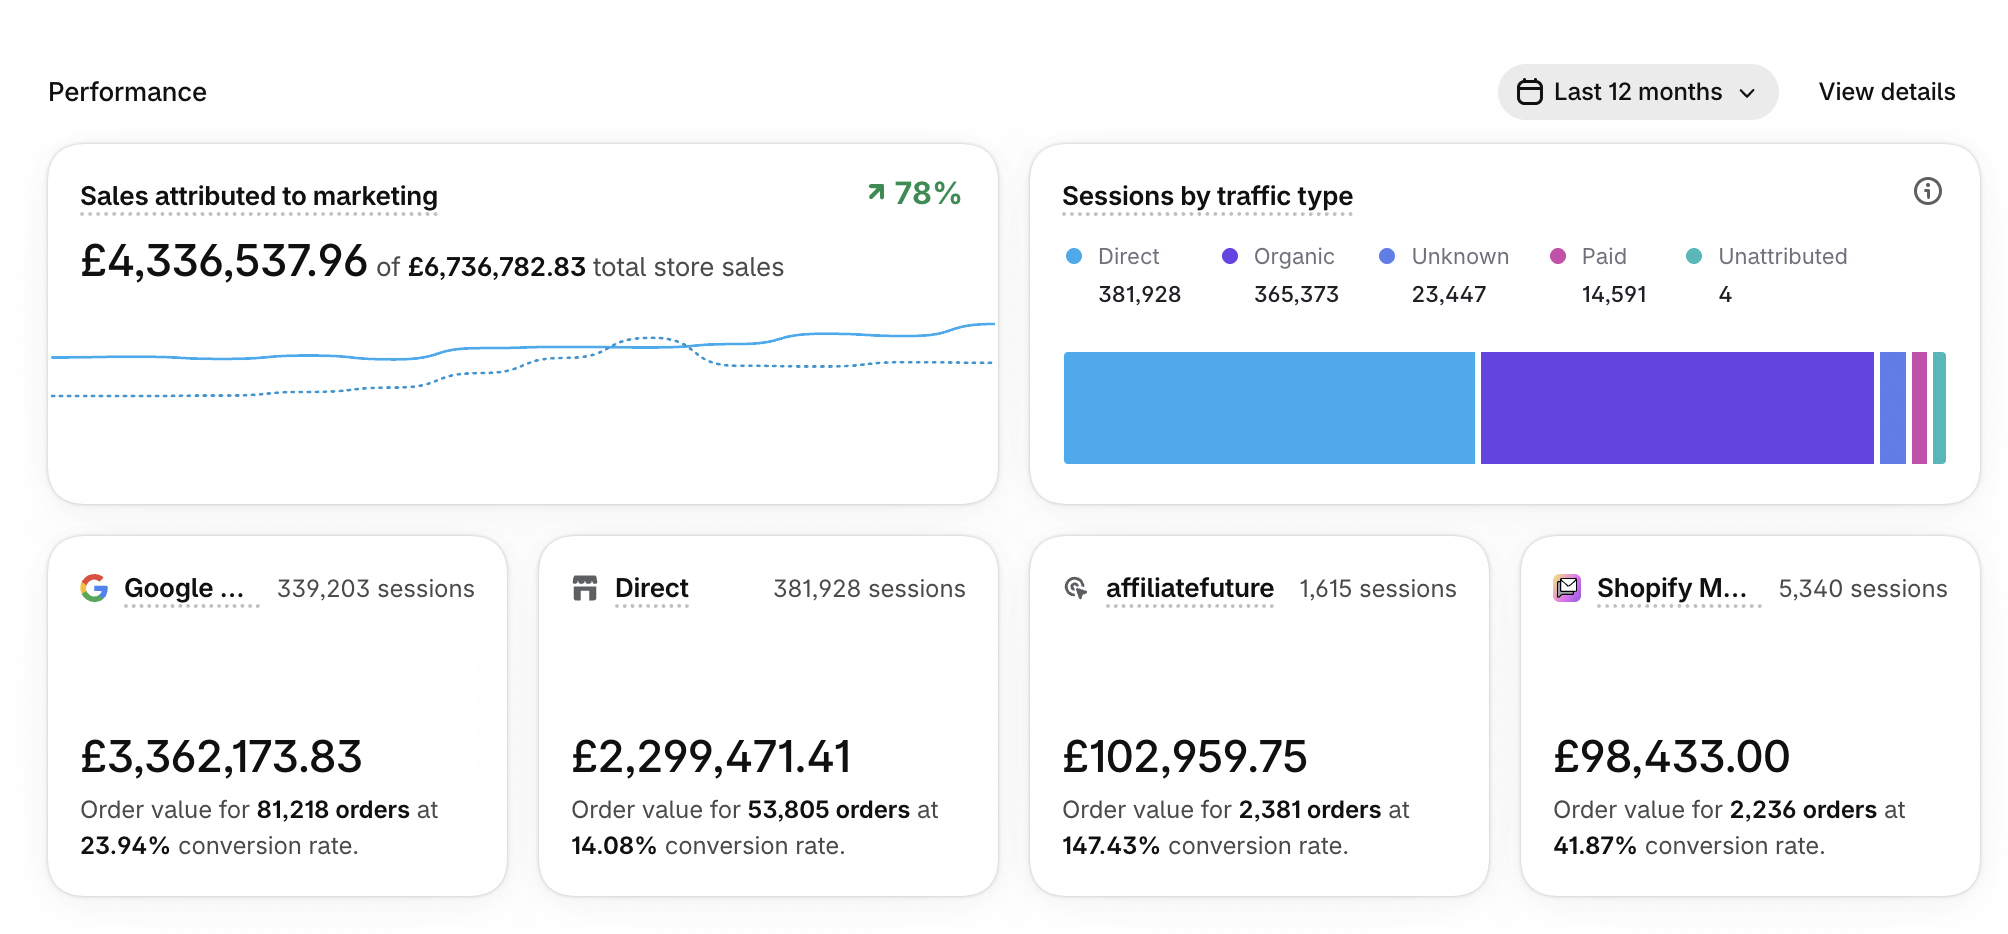
Shopify’s marketing view adds another perspective on how customers reached the store and how the platform attributed sales.
£4,336,537.96 · +78% as reported
Shopify traffic-type classification
A separate source of store traffic
 View original at full size
Attribution has limits.
Marketing-attributed sales are not the same as organic-search revenue. This screenshot does not show its attribution model or exact date boundaries. Channel-specific revenue is not claimed from the truncated cards. Google AI impressions and Shopify sessions are separate measures and should not be added together.
What could your store
do better next?
Start with the customer journey, search performance and the commercial data. We’ll discuss which work deserves attention first.
Bring your store’s
next challenge
to CartCompound.
Whether you need a stronger content strategy, technical improvements or a broader store revamp, we can discuss the work your business needs.
Discuss your storeFind the right service