The short answer
Use incremental contribution before SEO costs, subtract the full SEO investment, then divide by that investment. Treat attributed organic revenue as a reporting lens. Estimate a credible no-change baseline and show a range because attribution alone cannot establish causation.
Choose the decision and the accounting boundary
An SEO ROI report should answer a funding question: should the store continue, expand, reduce, or change this program? Begin with the investment being evaluated. A collection-page improvement, a migration safeguard, and an ongoing editorial program have different costs, risk, and timelines. Combining them into a single monthly ratio hides the reason for the spend. Record the decision owner, cohort of affected pages, implementation date, and review period before looking for a favorable result.
Use a contribution definition the finance owner can reconcile. In this guide, contribution before SEO costs means net merchandise revenue less product cost, payment fees, fulfillment, shipping subsidy, and expected return-related variable cost. Exclude sales tax collected for authorities. Document how shipping income and refunds are handled. This is a management measure, so consistency matters more than the label. A high-margin accessory and a bulky low-margin product should not be assigned the same profit rate just because both appear in organic search.
Separate operating contribution from cash timing. Inventory purchases can consume cash before orders are sold, while an agency invoice may be paid after delivery. A profitable scenario can still strain working capital. Give the founder a profit view and a simple payment schedule rather than presenting ROI as a complete cash forecast.
Build a complete investment ledger
The SEO investment includes more than the retainer. List research, writing, editing, product photography commissioned for the work, development, technical review, analytics setup, translation, and project management. Include meaningful internal time at an agreed planning rate. Mark shared tools and common infrastructure with an allocation rule instead of charging the whole company subscription to one article. Avoid counting a developer invoice and the same hours inside a bundled retainer twice.
Distinguish one-time setup from ongoing maintenance. A useful page may require future stock-link checks, product replacements, and evidence updates. Include those costs in the forward plan. If the evaluation stops at launch, the program can appear cheap by shifting necessary work into an invisible future budget. Conversely, do not expense the entire website rebuild against a small SEO project without explaining why the project owns it.
Create columns for date, supplier or internal owner, workstream, amount, allocation, and evidence link. Record committed but unpaid costs as well as paid invoices. Decide whether this is an actual-period return or a lifetime investment model. Mixing six months of benefits with one month of costs is a common way to create an impressive number that cannot guide a repeatable decision.
 Keep this framework
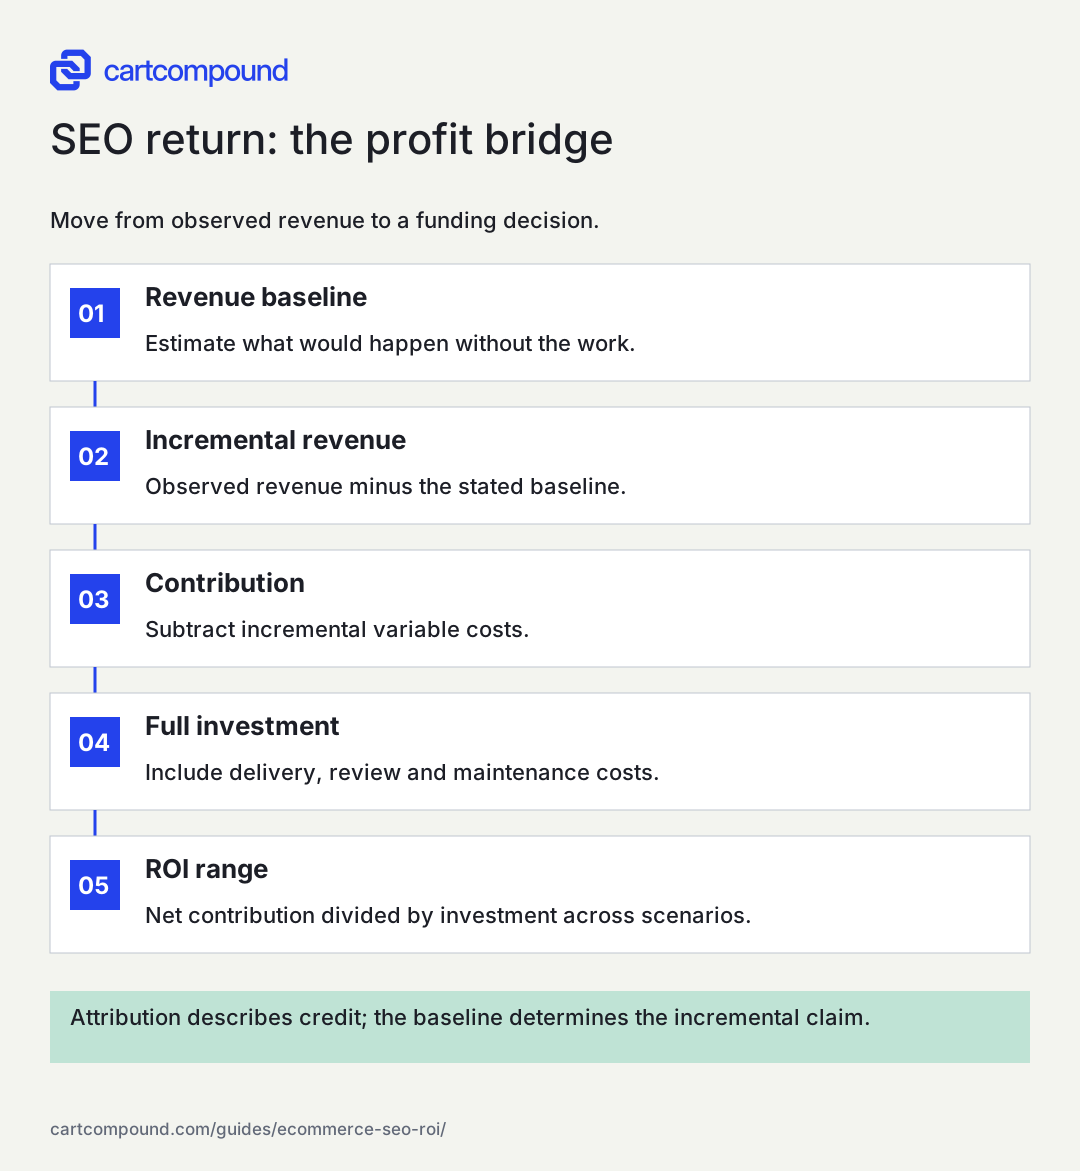
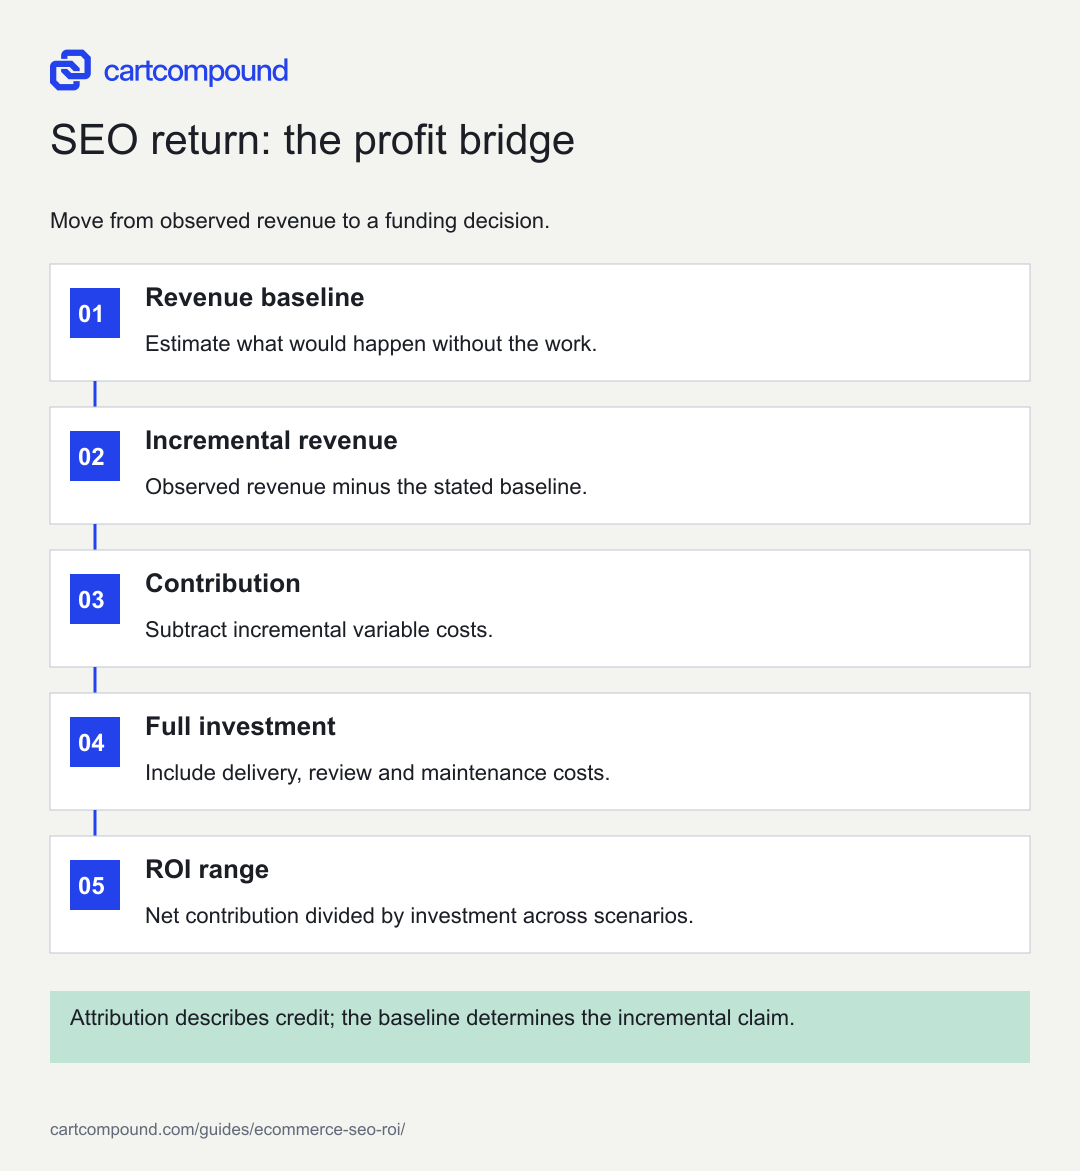
SEO return: the profit bridge
Move from observed revenue to a funding decision.
- Revenue baselineEstimate what would happen without the work.
- Incremental revenueObserved revenue minus the stated baseline.
- ContributionSubtract incremental variable costs.
- Full investmentInclude delivery, review and maintenance costs.
- ROI rangeNet contribution divided by investment across scenarios.
Attribution describes credit; the baseline determines the incremental claim.
Use the steps with your store data. Examples in this guide are illustrative unless a source is named.
Keep attributed revenue and incremental revenue apart
Analytics can allocate purchase credit to search touchpoints. It cannot, by itself, tell you whether the customer would have purchased without the SEO work. Branded search may reflect advertising, repeat purchase, or offline awareness. A returning customer can enter through a guide after first learning about the store somewhere else. The reporting model determines which touchpoint receives credit. Google explains how reporting attribution affects event-scoped revenue and key-event credit. Record the model and dimension scope beside every channel figure.
Keep three columns: observed organic-attributed revenue, estimated revenue without the project, and the difference you are evaluating. The third column is an estimate of incremental revenue, not a new analytics metric. Document the baseline method and its limitations. A simple prior-period comparison is useful for monitoring but weak for causal claims when stock, prices, media, or seasonality changed.
Do not add organic-assisted revenue to organic last-click revenue as though they are distinct sales. One order can appear in several journey descriptions. Use an order-level or consistently defined channel total for financial arithmetic, and keep path analysis as explanatory evidence. When changing attribution settings, annotate the date and avoid interpreting a redistribution of credit as new money entering the business.
Construct a baseline you can challenge
Start with a comparable historical period, then inspect the differences that matter. Match weekday patterns and seasonal context. Look for promotions, product launches, availability, country mix, and changes in paid search. A collection with its bestseller unavailable for half the comparison period cannot support a clean inference about copy quality. Keep those facts in the baseline notes rather than smoothing them out silently.
Where feasible, use a phased rollout with comparable page groups. Record pre-change trends and assign the rollout so the team is not simply selecting the pages most likely to grow. An untreated group can help estimate broad demand changes, but categories differ in intent and inventory. A comparison group is evidence, not automatic proof. For a large investment, obtain analysis support before describing the difference as causal lift.
Build conservative, central, and optimistic baselines. Use assumptions that have an operational reason, such as lower demand, stable demand, and a documented product restock. Do not create a narrow range just to make the investment appear certain. If modest baseline changes reverse the decision, the honest conclusion is that the ROI remains sensitive. Funding a smaller next phase may be more sensible than arguing about a single decimal.
Work through an illustrative profit calculation
Suppose a six-month collection improvement program costs $12,000 in agency work, $4,000 in development, and $2,000 in internal review. Total investment is $18,000. Over the review period, the affected organic landing-page group records $160,000 in net merchandise revenue. The central no-project baseline is $110,000, giving estimated incremental revenue of $50,000. These are illustrative assumptions, not a store result.
Assume incremental product mix produces a 45% contribution rate before SEO investment. Incremental contribution is $50,000 multiplied by 0.45, or $22,500. Net contribution after the program is $4,500. ROI is $4,500 divided by $18,000, or 25%. Reporting $160,000 divided by $18,000 would produce an 8.89 revenue-to-cost ratio, but that is not this profit ROI calculation.
Now challenge the baseline. If no-project revenue would have been $130,000, incremental revenue is $30,000, contribution is $13,500, and ROI is negative 25%. If the baseline is $90,000, contribution is $31,500 and ROI is 75%. At the same 45% contribution rate, the program needs $40,000 incremental revenue to cover $18,000. That break-even requirement gives the founder a concrete question to examine against demand, stock, and implementation evidence.
Use a diagnostic worksheet instead of a headline ratio
On a small screen, swipe the table to see every column.
| Observation | Check before explaining it | Decision implication |
|---|---|---|
| Organic revenue rises but contribution falls | Discount depth, returns, fulfillment and product mix | Repair economics before expanding traffic |
| Clicks rise but affected-page sales do not | Intent, stock, destination and event coverage | Inspect merchandising and measurement |
| Branded growth dominates | Paid activity, repeat customers and brand demand | Limit the incremental claim |
| Launch cost is high and early return is low | Implementation date, lag and future maintenance | Evaluate the planned horizon |
| Result changes sign across reasonable baselines | Counterfactual assumptions and comparison groups | Fund a bounded next phase |
Use the worksheet in a review meeting with someone who can challenge the assumptions. For each row, attach the supporting export and an owner. Distinguish confirmed facts from hypotheses. A verified inventory outage is different from a belief that competitors became more aggressive. The next action should resolve the largest decision uncertainty, not simply add more columns.
Also examine what the program prevented. Redirect QA during a migration can reduce the chance of a severe loss even when it creates no visible traffic increase. Evaluate such work using scenario costs, probability ranges, and the actual prevention scope. Keep this risk argument separate from measured incremental revenue. Counting a hypothetical avoided loss as booked profit would overstate the financial outcome.
Review payback, lag, and the remaining uncertainty
A positive six-month total does not reveal when the investment paid back. Plot cumulative incremental contribution against cumulative SEO costs. Payback occurs when the former covers the latter under the stated assumptions. Use the actual implementation dates because work approved in January but released in April had no opportunity to influence February revenue. Include content maintenance and any future development dependency in the forecast.
Track leading evidence without assigning it a fabricated dollar value. Pages becoming accessible, qualified queries reaching the right category, and shoppers reaching relevant products help explain the sequence. They are useful implementation and demand indicators. They are not substitutes for contribution. If visibility improves while the relevant products remain unavailable, the next funding decision may involve inventory rather than another editorial batch.
Choose a recurring review interval that matches order volume and purchase cycle. Preserve the original baseline and add a revised forecast alongside it when conditions change. Rewriting history makes accountability impossible. End each review with a specific decision, an uncertainty, and a date: for example, continue the affected category for another complete demand cycle, cap new production, and reassess after the next return cohort matures.
Handle assisted purchases and retained value carefully
A guide can help a shopper who returns later through email or direct navigation. Keep an assisted-path report to understand that behavior, but do not add the entire assisted order value to the financial model. The order already exists in the store total. Decide how the model treats later purchases and preserve the same rule across periods.
For a repeat-purchase product, a cohort view can be useful. Track actual later contribution from customers associated with the affected entry paths, then compare it with a stated baseline. Do not attach a storewide lifetime-value multiplier to every new organic customer without checking product mix, repeat behavior, observation time, and acquisition differences. Future value remains a forecast until it is realized.
Separate a content asset's remaining usefulness from its past return. A page that has not paid back yet may still deserve maintenance if its future incremental contribution plausibly exceeds the remaining cost. A page that paid back historically can still become uneconomic to maintain. Evaluate sunk costs in the historical report and future costs in the next decision without mixing the two.
Make the next SEO investment reviewable
Prepare one page containing the objective, affected pages, implementation evidence, full costs, contribution definition, baseline range, ROI range, and cash commitments. Add a short change log for price, stock, campaign, measurement, and attribution changes. The document should allow a finance colleague to reproduce the arithmetic without needing a presentation from the agency.
If records are incomplete, start with a descriptive return report and label the incrementality estimate as unresolved. Reconcile ecommerce events before making budget changes from channel revenue. Choose one category with dependable margin and inventory records, then build the first model there. That narrower model can be more useful than a storewide estimate with assumptions no one can defend.
The immediate next action is to complete the cost ledger and calculate break-even incremental revenue at the relevant contribution rate. Compare that requirement with an evidence-based range of demand and execution capacity. Decide what additional evidence would change the funding choice. This makes the report a decision tool while keeping the limits of channel attribution visible.
Your action checklist
Use this to decide what to do next. Your checks stay on this page and are not sent or saved.
0 of 8 checked
Common questions
Should branded organic sales count in SEO ROI?
Include them in descriptive reporting, then explain how the project could have influenced them. Avoid treating every branded order as incremental. A brand campaign or established repeat demand may explain much of the movement.
Can a guide have ROI before its visitors buy?
You can report qualified product discovery and later observed paths, but a financial return needs a defensible revenue and contribution model. Keep leading indicators separate while the purchase cycle develops.
What if the agency reports only revenue?
Ask for the exact revenue definition, attribution scope, full investment cost, and the baseline. A revenue-to-fee ratio can be informative, but it does not establish profit or incremental return.
Sources and review
Source documentation checked October 27, 2026. Platform features and interfaces can change. The recommendations and illustrative examples explain how to make the decision; they do not promise results.
- Change the reporting attribution model for key events
Event-scoped attribution changes revenue credit; session-scoped dimensions are unaffected.
Talk through your store question
Bring one problem you want to solve.
A free 20-minute call with Hamid can help you decide what to investigate next.
Book a free 20-minute call
About the author
Hamid Khan
Hamid co-founded CartCompound and works with ecommerce founders on their stores and growth priorities.
Profile and guides